| • | To apply the Tone curve effect |
The Tone curve filter lets you perform color and tonal corrections by adjusting either individual color channels or the composite channel (all channels combined).
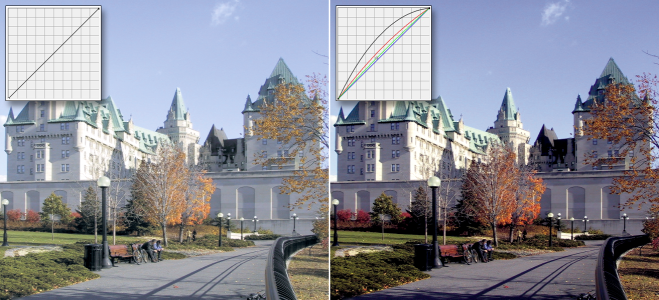
Original image (left); the image with adjusted tonal range (right)

The x-axis of the graph represents the tonal values of the original image; the y-axis of the graph represents the adjusted tonal values. Moving the curve up and to the left lightens the image and increases the color in any channel; moving the curve down and to the right darkens the image or decreases the color of a given channel. If you have an image with a blue cast, for example, you can decrease the blue in the image by selecting the Blue channel from the Active channel list box and moving the curve down and to the right.
| To apply the Tone curve effect |
|
| 1 . | Select a bitmap. |
| 2 . | Click Effects |
| 3 . | Choose a color channel from the Active channel list box. |
| 4 . | Choose a curve style from the Style list box. |
| • | Curve — smooths the distribution of the values |
| • | Straight — retains straight line segments between nodes |
| • | Freehand — lets you draw a freehand curve |
| • | Gamma — lets you weigh corrections toward the midtones |
| 5 . | Click and drag the curve in the preview window to adjust the bitmap interactively. |
|
Enable the Display all channels check box.
|
|
|
Click the Eyedropper tool, and click in the image. The pixels that you select appear as nodes on the tone curve.
|
|
|
Click the Smooth button.
Tip: Click and hold the Smooth button down to continuously smooth the tonal curve.
|
|
|
Click the Reset active channel button.
|
|
|
Click the Reset button.
|
|
|
Click Auto balance tone button.
To specify the outlying pixels (clipped pixels) at each end of the tonal range, click the Settings button and specify the Black limit to and White limit to values in the Auto-adjust range dialog box.
|
|
|
Click the Open button
|
|
|
Click the Save button
|
To flip the axis of the grid, click the Invert button ![]() .
.
To change the resolution of the grid, press Alt and click in the preview window.
To invert the selected tonal curve, click the Horizontal Flip ![]() or Vertical Flip buttons
or Vertical Flip buttons ![]() .
.
The histogram lets you view the adjusted tonal range and evaluate the results. For more information about histograms, see Using the histogram.
![]()
Not all suite components documented in this Help are available in our Trial, Academic, and OEM versions. Unavailable components may include Corel applications, product features, third-party utilities, and extra content files.
Copyright 2018 Corel Corporation. All rights reserved.