Tone Curve
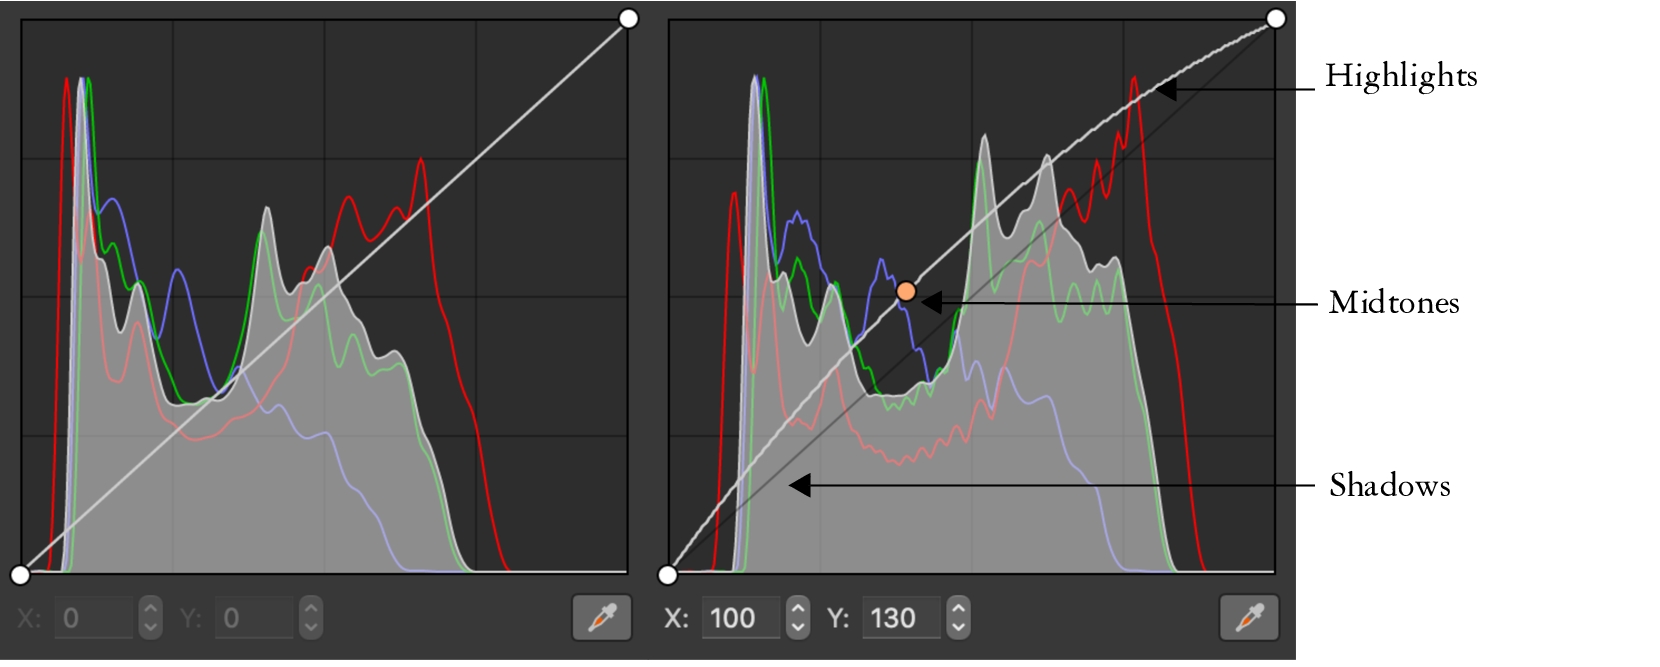
The Tone Curve filter lets you perform color and tonal corrections by adjusting either individual color channels or the composite channel (all channels combined). Individual pixel values are plotted along a tone curve that appears in a graph and represents the balance between shadows (bottom of graph), midtones (middle of graph), and highlights (top of graph). The x-axis of the graph represents the tonal values of the original image or the input values; the y-axis of the graph represents the adjusted tonal values or the output values.
The tone curve shows the balance between the shadows, midtones, and highlights of an image. (left) The tone curve of an image before tonal adjustments. (right) This example shows a small adjustment to the tonal range, in which pixel values of 100 are replaced with pixel values of 130 to lighten the midtone areas.
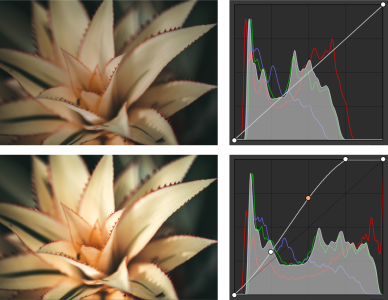
You can fix problem areas by adding nodes to the tone curve and dragging the curve. If you want to adjust specific areas in an image, you can use the Color eyedropper (Sample tone from image) tool and select the areas in the image window. You can then drag the nodes that appear on the tone curve to achieve the effect you want.
Original image (top); the image with adjusted tonal range (bottom)
The histogram lets you view the adjusted tonal range and evaluate the results. For more information about histograms, see Histograms.
To fine-tune your adjustments, you can click the Preferences button and choose a style from the Curve Style menu. For example, you can redraw the curve by using freehand lines or straight line segments.
You can also access the Tone Curve filter from the Adjust menu, or by pressing Command + T.

