Tone Curve filter
The Tone curve filter lets you perform color and tonal corrections by adjusting either individual color channels or the composite channel (all channels combined).
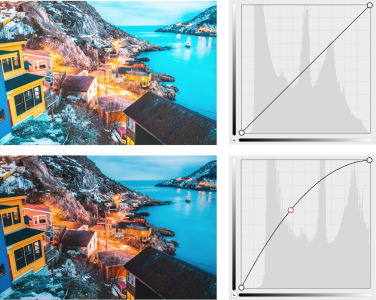
Original image (left); the image with adjusted tonal range (right)
Individual pixel values are plotted along a tone curve that appears in a graph and represents the balance between shadows (bottom of graph), midtones (middle of graph), and highlights (top of graph).
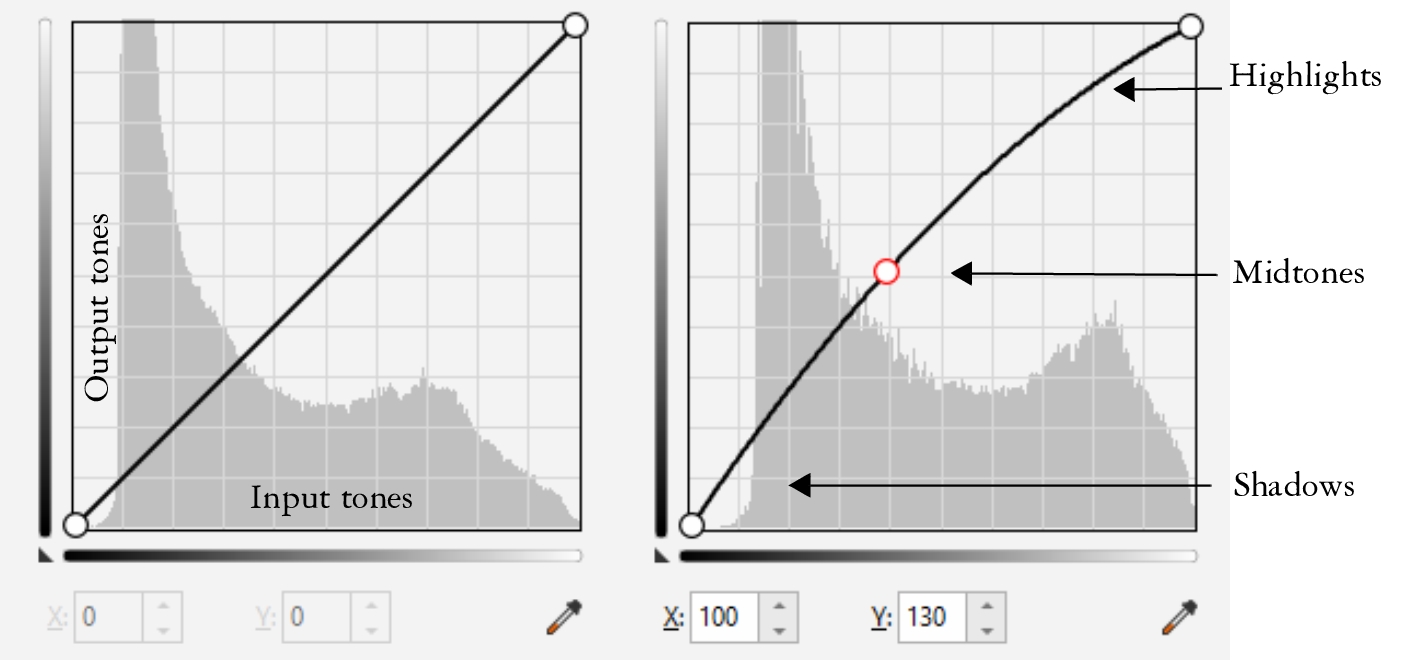
The tone curve shows the balance between the shadows, midtones, and highlights of an image. (left) The tone curve of an image before tonal adjustments. (right) This example shows a small adjustment to the tonal range, in which pixel values of 100 are replaced with pixel values of 130 to lighten the midtone areas.
The x-axis of the graph represents the tonal values of the original image; the y-axis of the graph represents the adjusted tonal values. Moving the curve up and to the left lightens the image and increases the color in any channel; moving the curve down and to the right darkens the image or decreases the color of a given channel. If you have an image with a blue cast, for example, you can decrease the blue in the image by selecting the Blue channel from the Active channel list box and moving the curve down and to the right.
You can adjust the color and tone of an image by dragging the tone curve interactively in the preview window, adding one or more nodes to the tone curve, selecting areas in the image window, or applying a preset. You can adjust multiple points along a curve, so you can lighten the shadows and darken the highlights.
You can also save tone curve settings as presets to use with other images. Response curve files are saved with the extension .pst.
To apply the Tone curve effect
To flip the axis of the grid, click the Invert button ![]() .
.
To change the resolution of the grid, press Alt and click in the preview window.
To invert the selected tonal curve, click one of the Mirror Curve buttons.
The histogram lets you view the adjusted tonal range and evaluate the results. For more information about histograms, see Using the histogram.