Histograms
A histogram lets you view the tonal range of an image so that you can evaluate and adjust the color and tone. For example, a histogram can help you detect hidden detail in a photo that is too dark because of underexposure (a photo taken with insufficient light).
A histogram has a horizontal bar chart that plots the brightness values of the pixels in your image on a scale of 0 (dark) to 255 (light). The left part of the histogram represents the shadows of an image, the middle part represents the midtones, and the right part represents the highlights. The height of the spikes indicates how many pixels are at each brightness level. For example, a large number of pixels in the shadows (the left side of the histogram) indicates the presence of image detail in the dark areas of the image.
A histogram is available in the Adjustments docker, the Image Adjustment Lab as well as with the following filters:
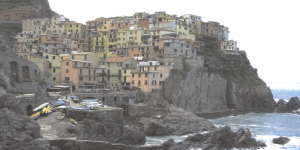
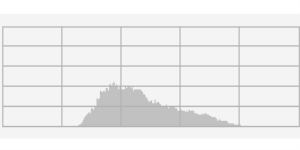
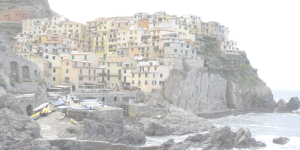
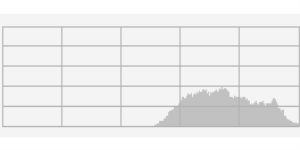
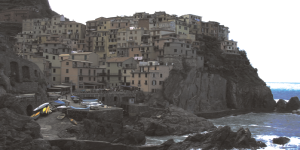
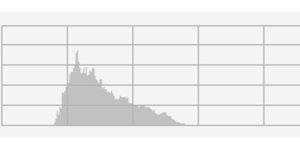
Each photo above has a different exposure: average (top), overexposed (middle), underexposed (bottom). The histograms for each photo (on the right) show how the pixels are distributed, from dark to light. In a photo with average exposure, pixels are more evenly distributed across the tonal range.
To use the histogram in the Adjustments docker
|
This control detects the lightest and darkest areas and adjusts the tonal range for each color channel. The adjustment is non-destructive and can be turned off or on.
|
|